View Types
Skiamap Presenter can generate as a result html, three types of view :
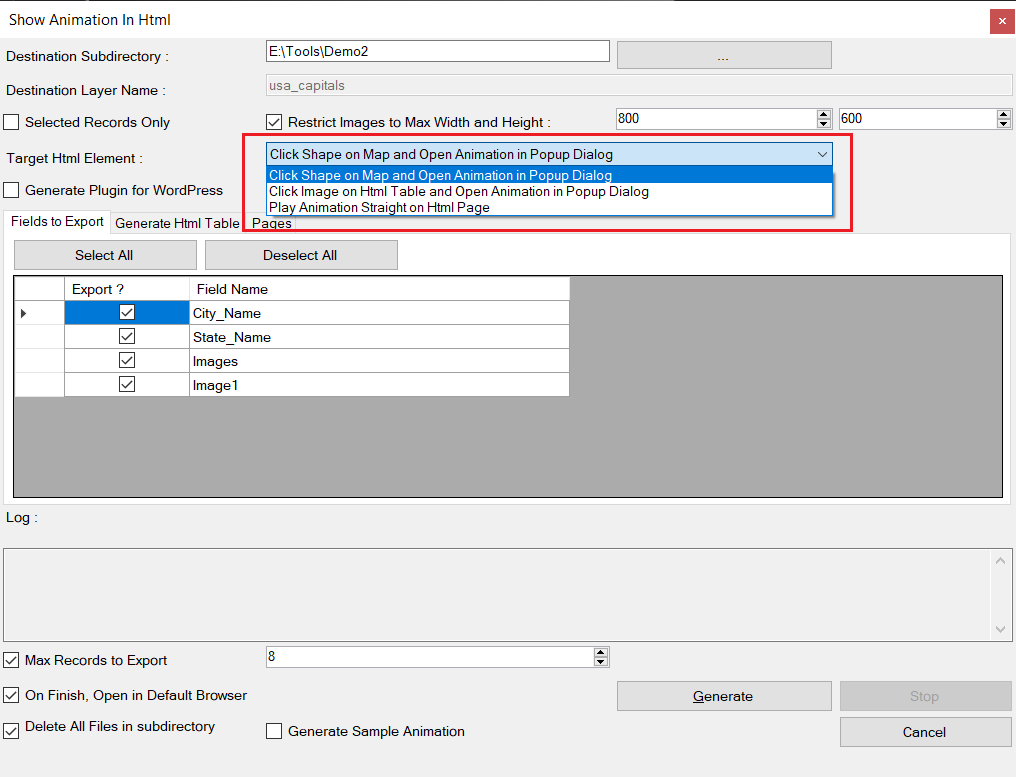
- Click shape on map and open animation in Popup dialog.
- Click image on html table and open animation in Popup dialog.
- Play animation straight on html page.
Click shapes on the map and open animation in Popup dialog when clicked one.
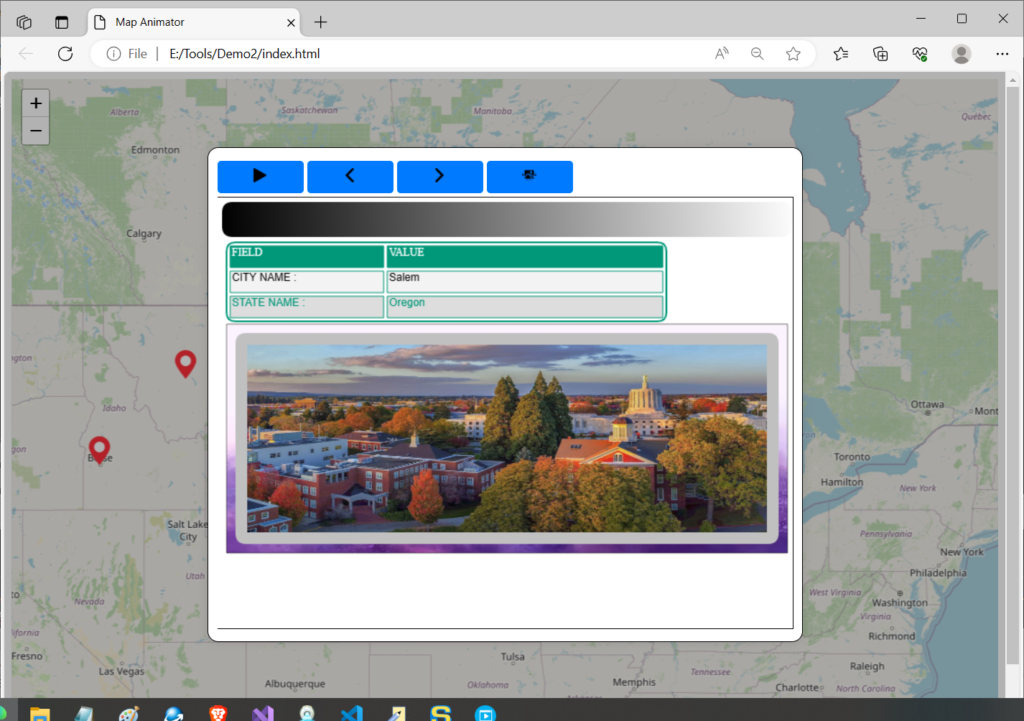
As you can see from the above screenshot, your designed animation is opened when you click a marker, polygon or polyline on the map. A dialog is opened and start playing the animation from the first page. The buttons at the top of the animation includes options for:
- Play Again the Animation.- Click this button in order to play again the animation.
- Previous Page.- Click this button to jump from the current page to the previous one. If the current page is the first page, this button will do nothing.
- Next Page.- This button will allow you to jump to the next page in the list of pages for your designed animation. If the current page is the last page in the list, then this button will do nothing.
Click grid of images on Html table and open animation in a Popup dialog when clicked one.
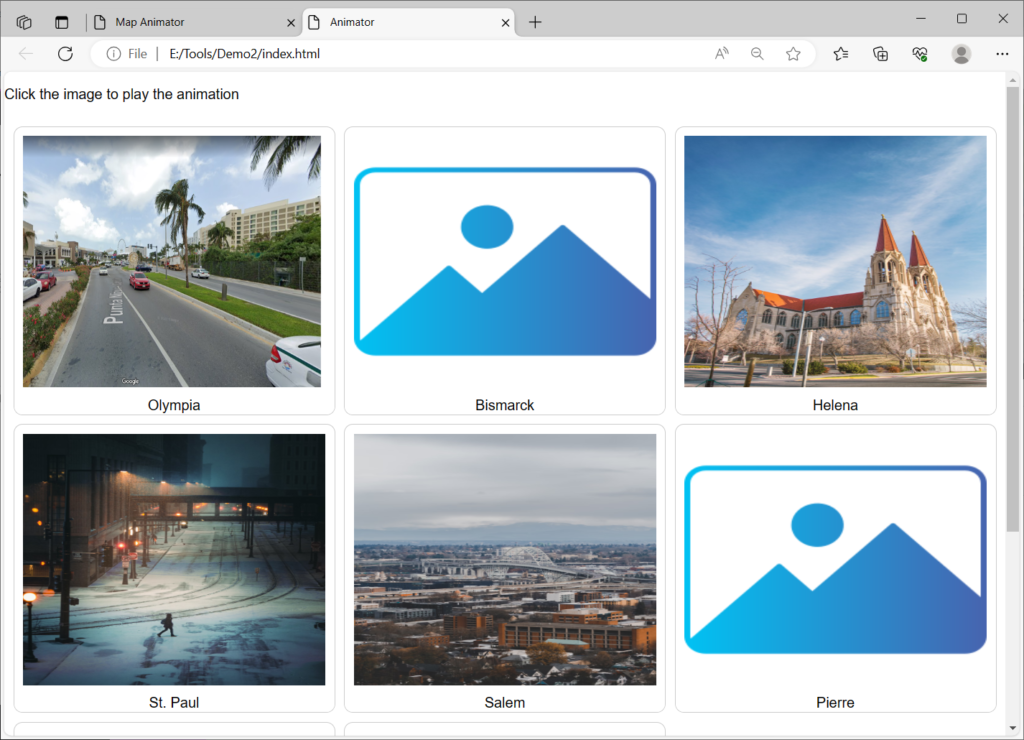
The result html file of this option creates a table of N columns (the columns you have specified) and every cell is filled with an image coming from a field of the database table or layer (which you also defined).
When you click an image, a dialog is opened and start playing the designed animation.
The image for every cell comes from an image field in the database table.
For this type of view, you need to configure the following fields:
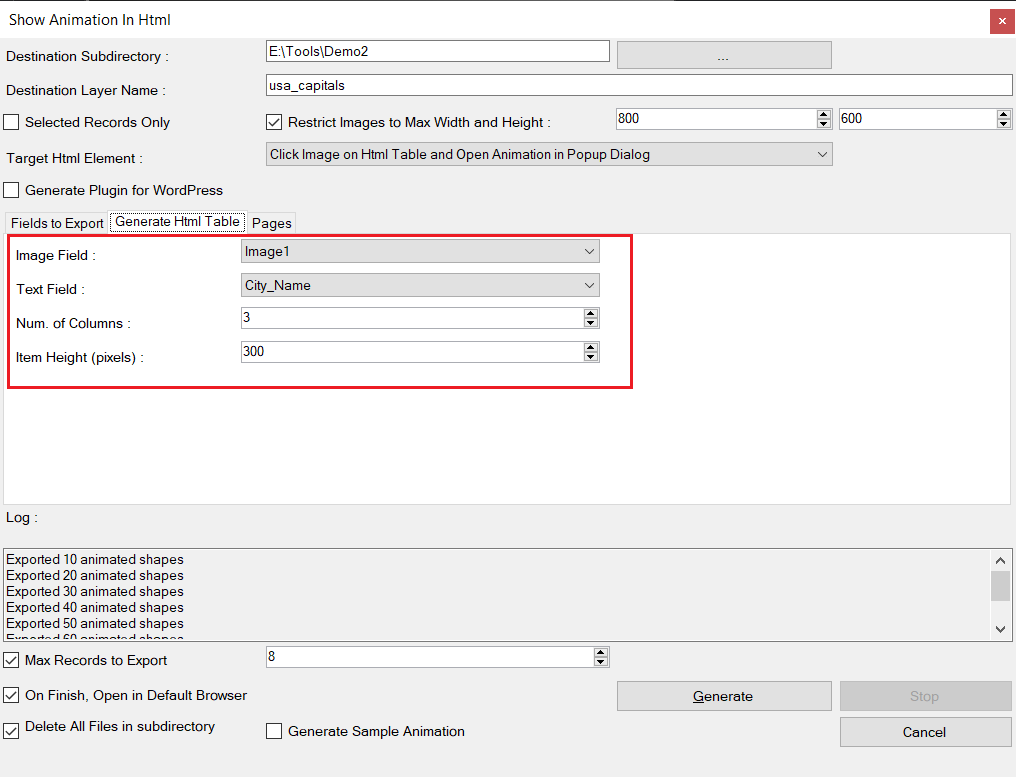
- Image Field.- Choose the field from the combo box for the fields of the layer to which this animation belongs to.The field must be a field that store images and the image will be used as the image representing the field of the record. When you click the image, the animation will open in a popup dialog.
- Text Field.- This must be a text field similar to the previous field but this time the field store text defining the meaning of the record and the value of the field will be displayed below the image as shown in the previous screenshot.
- Number of Columns.- Defines how many columns will have the grid on the html page. The number of rows is calculated depending on the number of records exported divided by the number of columns.
- Item Height.- Defines the height in pixels, of the image on the exported html table element.
Play Image straight on the exported html page
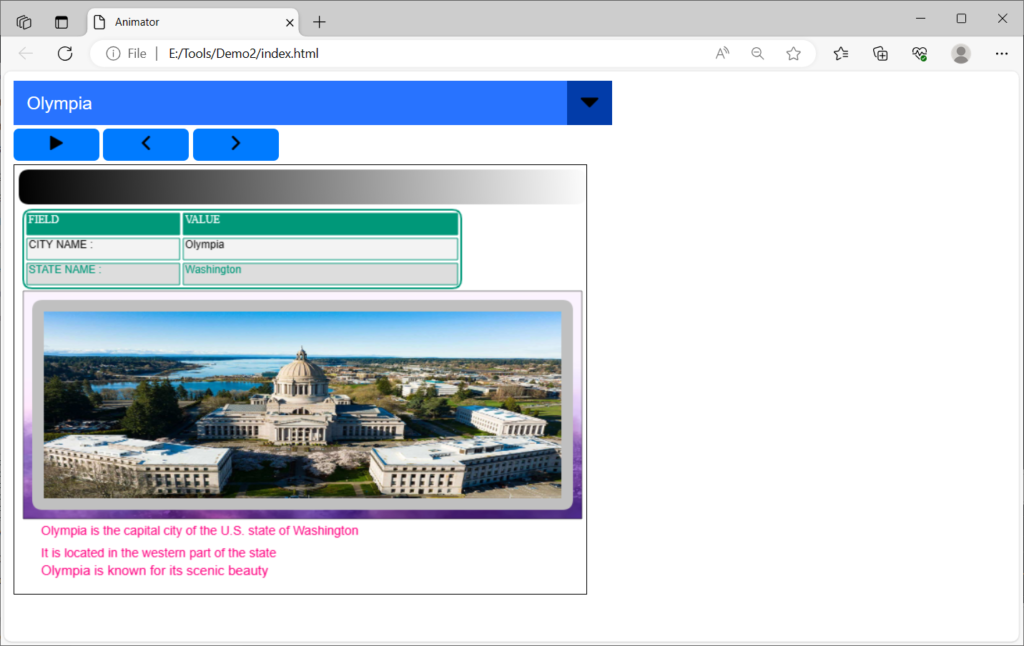
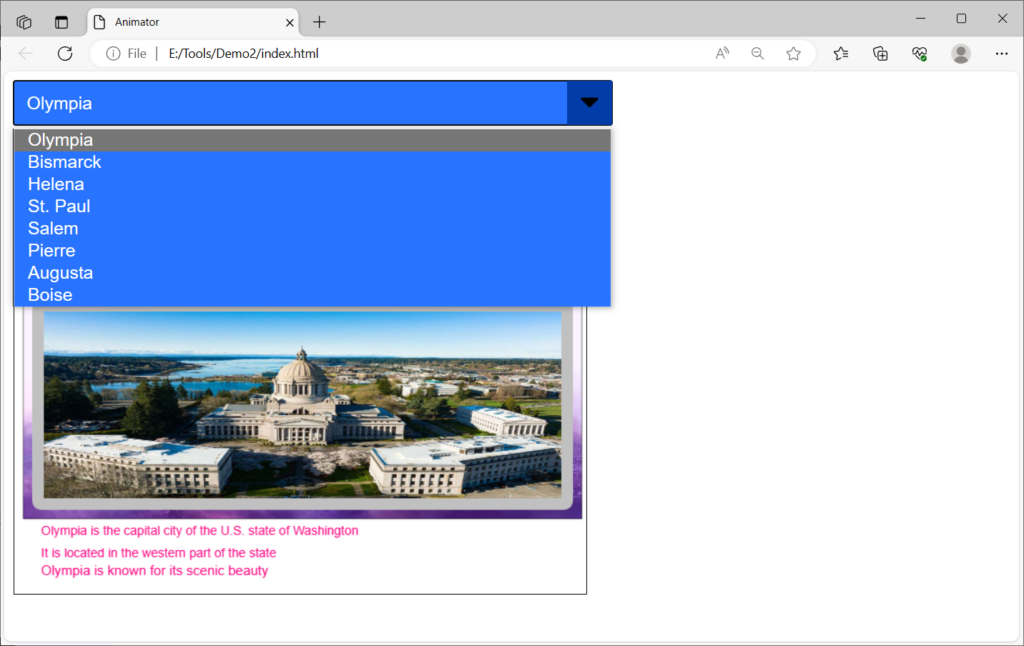
As you can see from the above screenshots, the result animation is placed on the result html page without the need to open a popup dialog by clicking a shape on the map or on an image.
A combo box that contains all the records exported is also exposed and you can choose one of the items in order to adjust the animation accordingly to that item which feed the animation from the values of the fields extracted from the database table records.
For this option you only need to define the database table text field, using its values to populate the combo box items.
