SkiaMap Presentations
SkiaMap Presentations Editor
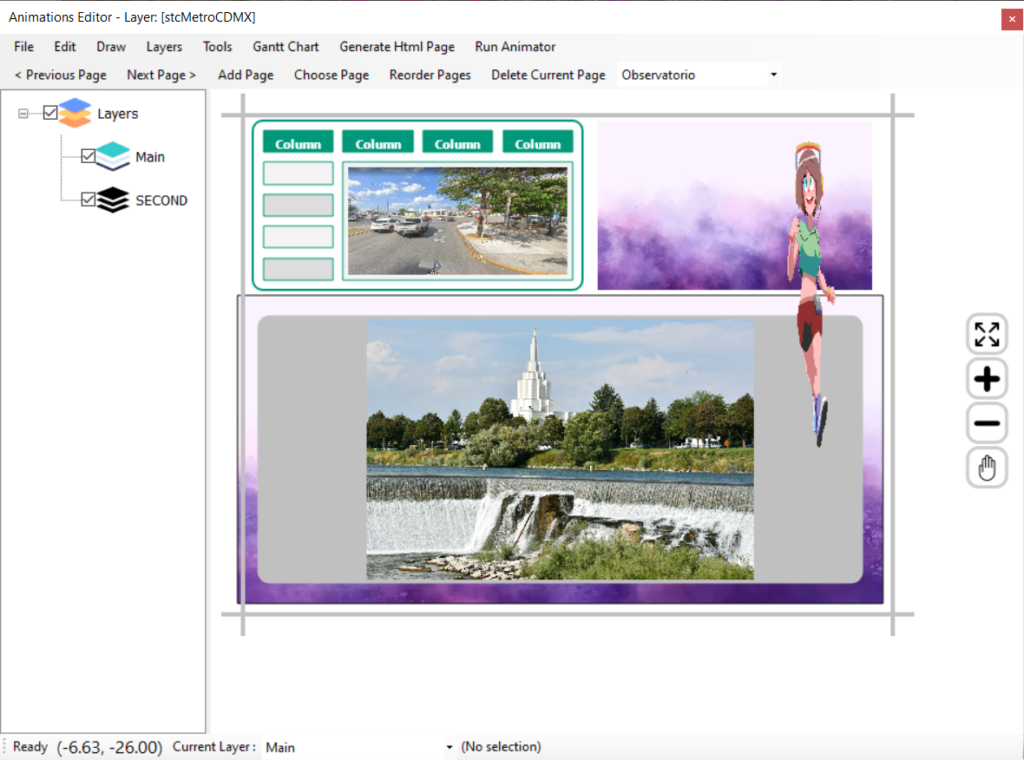
The SkiaMap Presentations Editor, also known as the Animations Editor, allows you to create presentations for a specific layer, incorporating shapes and animations for each shape. The drawable shapes encompass images, polygons, polylines, rectangles, text, animated GIFs, splines, ellipses, and special shapes like Area Guide shapes and others. Each shape can be associated with one or more animations, including animated GIFs, movement, rotation, scaling, animation along a path, multicolored transitions, particle effects, camera movements, and various other options.
The purpose of the next videos is to provide you with more information you may be interested in.

Intro to Animations Editor.
The following video is a short tutorial introducing you to using the Animations Editor to create shapes and their animations.
Animating a GIF image.
In this video tutorial, you will learn how easy it is to animate a GIF image file in your presentation.
Additionally, in this short tutorial, you will discover how to move and scale the animated GIF to an Area Guide shape.
Area Guides
Area Guides
Area Guides are rectangular shapes or geometries placed on the design area, invisible at runtime, and serve various purposes.
These shapes are useful, for instance, to move another shape to the center of a designated area guide or to scale another shape based on the dimensions of the area guide.
Area Guides are also beneficial for changing the view to the rectangular area of the guide, allowing you to zoom in. The video will demonstrate how to effectively use area guides.
Other animations and shapes
Animation tween image to area guide.
This tutorial is designed to guide you step-by-step on creating a mesmerizing animation of particles. You’ll utilize an image of your choice, tweed to an area guide shape that can be placed anywhere on your design area.
By following our comprehensive guide, you will discover the most effective techniques for manipulating particles in motion to create a visually-striking animation that will captivate your audience. We place great emphasis on making the tutorial as easy to follow as possible, ensuring readers with any level of experience can effortlessly follow along.
Table layout shapes.
The video explains how to create and configure table layout shapes.
Table layout shapes consists of rows, columns, its cells, can be defined row and column span, and the cells can contain text or images, and every cell can be configured its background and outline colors.
Also, a background color or gradient of two colors can be set for all tables.
Dynamically change text and images in the presentation.
The video explains the process of creating image and image collection fields for a map layer, along with populating geometries or shapes of the map with texts, images, and image collections for their respective fields.
Following this, a presentation will be created for that layer, and a text will be added to guide you on inserting special codes, which are the names of the fields of the layer.
Subsequently, an image will be added and linked to an image field of the layer, demonstrating how the designed image will be replaced by the image from the record or shape clicked on the map.
Carousel Shapes
The video will demonstrate that to create a carousel shape, you must first add an image collection field to one of the layers.
Subsequently, the video will guide you in learning how to create carousel shapes and configure them to define both the images and the accompanying texts. These shapes will be linked to an image collection field of a map layer.
It’s noteworthy that when you add a carousel shape to the design area, three text shapes are automatically added. These text shapes obtain their content from the configuration within the carousel shape and the images collection field.
